Local Pack Intent Gap, Slowing Search Spend, Review Star Chasm


Google Throttling Local Packs?
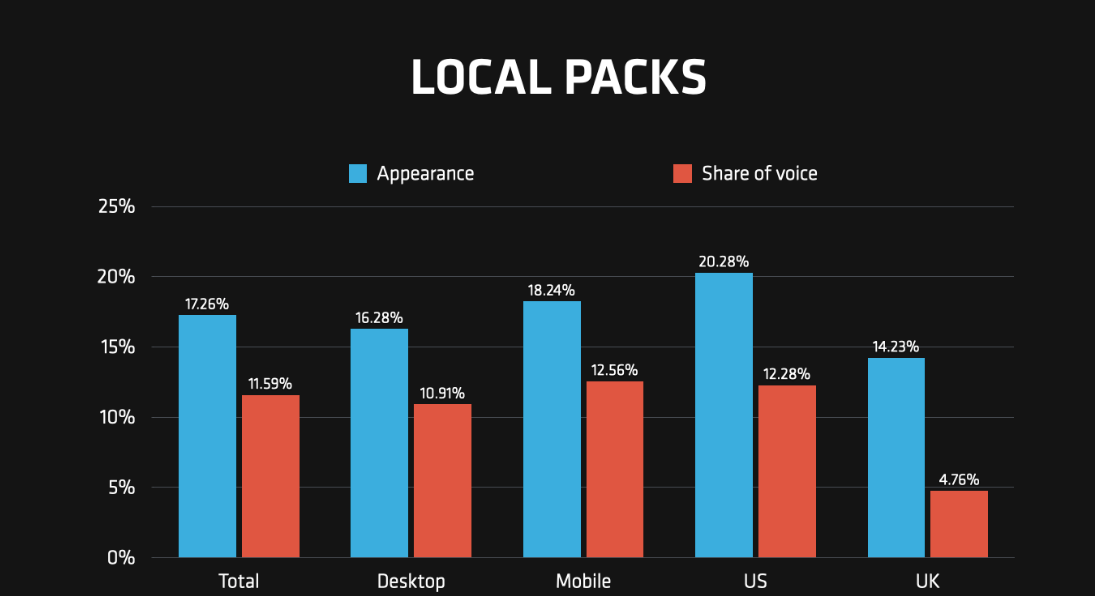
What's happening with the Local Pack? Last year, Moz and LocalSEOGuide noticed a drop Local Pack frequency, from 40% and 42% of SERPs to 24% and 36% respectively. Moz reports they're showing up even less frequently now. A related Q1 study by STAT (Moz) looks at the most common SERP features and their share of voice. Local Packs appear now for ~20% of queries, but are the most visible feature when they do. Local Packs "showed up on 18.24% of mobile SERPs compared to 16.28% of desktop SERPs." They're far less common than other features like related searches, PAAs and videos. Yet local-intent queries are more frequent than Pack appearances. Over the years, Google has given us different local search numbers. In 2011, the company said 20% of desktop queries carried local intent. In 2017, it was "nearly one-third of all mobile searches are related to location." But Google has also said, 40% of mobile traffic is local (Marissa Mayer 2011). And in 2018, Google unofficially said "46% of searches have a local intent." This leads us to declare a "Pack intent gap."
Our take:
- Local results and Local Packs aren't 100% synonymous. You can have localized results without Packs. That's happening more often now.
- Yet, in a recent SEO project Near Media performed for a multi-location service company, we saw Local Packs in ~73% of results.
- Google appears to be slowly throttling Packs for antitrust reasons ("self-preferencing"). It's also experimenting with Local Directory Carousels.
Ad Spend: Search & Social Slow
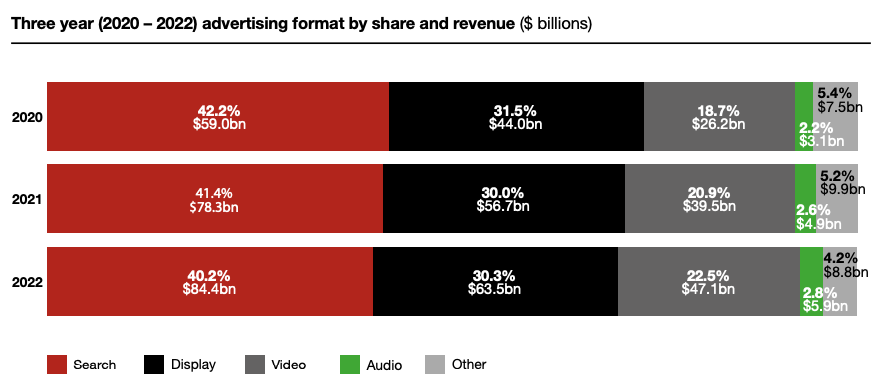
After a couple of pandemic-fueled years of record growth, digital ad spending came back down to earth in 2022. That's according to the new internet ad revenue report from the IAB and PwC. Last year, online spending still increased a respectable 10.8% to $209.7 billion. Paid search, the largest single category of online spending, grew more slowly at 7.8%. Display and video advertising both outpaced it, though from smaller bases. Social media ad spending was just under $60 billion and grew at 3.6% – the smallest increase in a decade. This is partly due to Apple's privacy controls. Speaking of which, mobile ad revenue outpaced total spending growth, at 14.1%. Overall, mobile captured 73.5% of total spending (up 2.2%). In traditional media, TV grew 2%, out-of-home 14.6% and cinema-based advertising 56.3%. Digital ad spending first overtook TV in roughly 2016; now it's more than 2X larger. On a related note, the IAB report says that "Consumers are now spending more time with creator content than with studio-produced video content," which is significant.
Our take:
- The top 10 ad platforms captured 76.8% of all online ad revenue ($161.1 billion). However that share is down slightly (1.8%) from last year.
- Paid search was $84.4 billion in 2022. Most of that money is Google's but growth is flattening, partly because of rising CPCs.
- Newer ad formats may continue to propel ad revenues but we've entered a period of lower growth for search, social and mobile.
Trust Chasm between 3 - 4 Stars
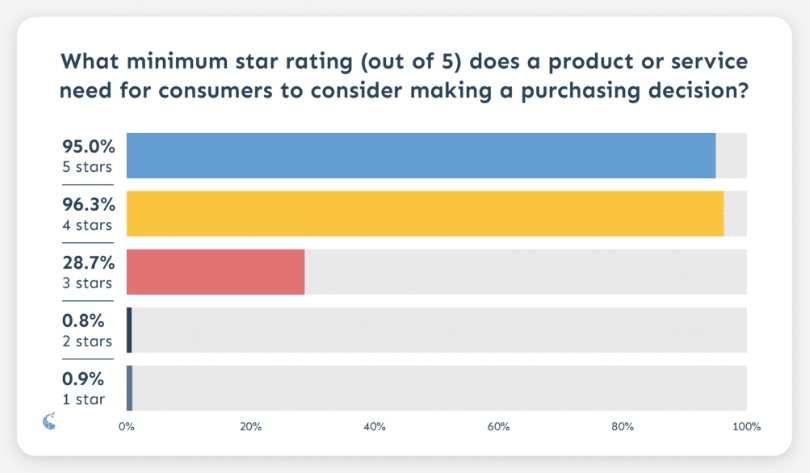
Despite increasing consumer skepticism, online reviews are arguably more important than ever. They're almost universally consulted (98%) and remain a powerful influence on consumer decision making. We know from many surveys that consumers now want to see 4+ star ratings before considering a product or service. Businesses and brands understand this, which is why there's so much review fakery happening. A new review survey from Go Fish Digital has a couple of interesting findings. It shows how consumer interest/trust falls off a cliff between three and four stars. While 96% of consumers would hypothetically trust businesses with 4+ stars, that number drops to 29% for businesses in the 3+ star range. From a business-owner perspective, the prospect pool drops by 70% if you don't have 4+ stars, hence the impulse to cheat. Another interesting finding: reviews are most used for items priced between $50 and $1K. Millennials and Gen Z are much more likely to consult reviews than older folks.
Our take:
- With the exception of BrightLocal, most review surveys are point-in-time studies. Understanding trends over time is increasingly important.
- We know many people address review distrust by using multiple sites to check directional review agreement (e.g., Google + Yelp + Tripadvisor).
- We also need to find out whether and what other sources people use to supplement reviews – TikTok, other social, expert reviews?
Short Takes
- Google testing Local Directory Carousel in US.
- Google now showing car carousel in mobile search results.
- Yelp unveils "most loved brands" list.
- Amazon is late to the generative AI party, but jumping in.
- Amazon: "the best place for advertisers to build their brands."
- AutoGPT is the next stage in AI and a step toward AGI.
- Substack CEO not ready for Notes content moderation challenge.
- Twitter letting users buy and sell stocks, hopes to become super app.
- Twitter Blue subscribers can now use 10K characters.
- Following NPR, PBS has also stopped tweeting.
- ChatGPT able to predict stock movements by analyzing headlines.
- Inflation, interest rates dampen US retail spending in March.
- MSFT integrates BingGPT into Swiftkey Android keyboard.
Listen to our latest podcast.

How can we make this better? Email us with suggestions and recommendations.